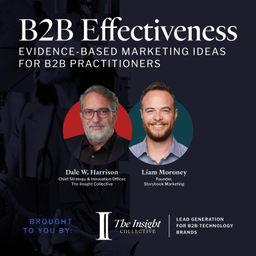
B2B Effectiveness
The Insight Collective
5.0from 2 ratings
- 14
- Episodes
- 2
- Ratings
- Weekly
- Cadence
- 2026
- First episode
About B2B Effectiveness
B2B Effectiveness: Evidence-Based Marketing Ideas for B2B Practitioners is a podcast for marketers who want evidence, not opinion. Marketing Scientist and host, Dale W. Harrison sits down with B2B marketing strategists to challenge the assumptions B2B marketing keeps repeating without checking — from lead scoring and demand generation to brand building and attribution — replacing conventional wisdom with research, real benchmark data, and hard-won practitioner experience. Each episode takes one persistent industry belief, tests it against the evidence, and leaves you with a sharper, more honest way of thinking about the problem.
- Publisher
- The Insight Collective
- Category
- business · business · business
- Language
- en
- Explicit
- No
- First episode
- 16 Jul 2026
- Latest episode
- 15 Oct 2026
Latest episodes
14 episodes in the feed.
15 Oct 2026
What Does Brand-Aware Search Really Measure? | B2B Effectiveness - Episode 14
Most B2B marketers have heard that share of search tracks share of market. Far fewer have asked where that idea came from, or whether it survives contact with a B2B market. It was drawn from a handful of B2C examples, and it only holds when products, prices and routes to purchase are close to uniform — which, as Dale W. Harrison puts it, is the difference between a tub of yogurt and a multimillion-dollar ERP system. In Episode 14, Dale W. Harrison and Liam Moroney ask what brand-aware search actually measures. They cover the conditions under which share of search does reflect market share, the price spreads, basket sizes, free trials and indirect sales that break it in B2B, why Buffer can hold nearly half the search volume in its category and about 1% of the revenue, how Sprout Social grew while its branded search fell, and why the metric is far more useful as a measure of category demand. Timestamps 0:33 Back for another episode — Dale and Liam reunite 0:47 This week's topic: what does brand-aware search actually measure? 1:08 Liam's starting point: years of branded search data 1:53 How a few B2C examples became a universal rule 2:25 A tub of yogurt versus a multimillion-dollar ERP system 3:01 You can't outsource your thinking — to research or to AI 3:45 The original claim: share of search reflects share of market 4:50 Share of search as a stand-in for share of voice 5:29 Brands do not grow: market share barely moves 6:30 When a leader stumbles: the password management example 7:53 It's actually measuring a lot of other useful things 8:24 Slides: when share of search does track market share 8:54 Product parity, price parity and how things are sold 10:37 The supermarket with an unwatched back door 11:41 No door-to-door detergent salesmen 12:24 Price discrepancy: $20 versus $200,000 13:15 Volume: one search, a thousand licenses 14:16 Microsoft Office, Exxon and 100,000-fold basket sizes 15:10 Drinks, houses and boxes of Tide: why B2C variance is small 16:31 Ehrenberg's own caution about uniform basket size 17:01 Light and heavy buyers in B2B search data 17:46 Free trials: noise that inflates search volume 18:35 Penetration is not revenue 20:43 Partners, procurement and cross-selling: revenue that never searches 21:42 Liam's in-house story: the vendor that sold itself in 22:29 Ideal conditions versus the typical B2B picture 23:35 Real data: the social media management category 23:59 Buffer versus Sprout Social: volume versus value 25:54 Nearly half the search volume, about 1% of the revenue 27:16 Sprout Social: branded search down, revenue up 28:17 Two stories: the company picture and the category demand picture 29:03 Growth from bigger contracts, not more customers 31:08 Detergent for families with 12 kids 32:37 Penetration and market share are two different things 33:06 HubSpot's users versus Salesforce's money 33:43 “Our revenue's never been better” 34:37 Hightouch and the declining CDP category 35:51 Defining penetration: the Tide example 36:55 HubSpot: 50% greater penetration, a fraction of the revenue 38:00 The Fortune 1000: 85% versus 0.4% 39:34 Where a brand's revenue actually comes from 41:28 Audience question: can you segment around the variances? 42:14 Branded search as a measure of demand 43:37 Fax machines and Ricoh: share up, category collapsing 46:02 Category demand: missing from B2B conversations 46:22 The bowtie and trying to outrun a lack of new business 47:50 The 95:5 rule and stationary markets 48:33 Why laundry detergent grows at about 2% a year 50:26 Dynamic tech categories: fax machines and CRM 51:45 Conditional win probability and the odds a lead is in market 52:37 Why a hot category makes you look like a genius 53:01 Televisions and the 8K flop 54:14 When good enough is good enough 54:59 Marketing automation and mechanical lead scoring 55:16 The lessons: active demand and category health 56:25 B2B demo software and a 99:1 market 57:11 NFTs and the crypto bros 58:04 Wrapping up Key Topics Discussed - Where the idea that share of search reflects share of market came from, and why it doesn't generalize to B2B - The conditions that make the proxy work: product parity, price parity and a single way to buy - Price discrepancy, seat-based volume and 100,000-fold differences in basket size - Free trials, partner ecosystems, procurement and installed bases: revenue that never shows up in search - Buffer versus Sprout Social: share of search against share of revenue - Two stories in one decline: company growth versus category demand - Penetration is not revenue: HubSpot versus Salesforce - Branded search as a gauge of category health, and what it means for the 95:5 rule - Why growing and shrinking categories make marketers look like geniuses or failures Notable Quotes “Nobody wants 100% of a market of which there are no customers.” — Liam Moroney “Market penetration is not the same thing as revenue, certainly not in B2B.” — Dale W. Harrison “HubSpot have lots and lots and lots of users, and Salesforce have lots and lots and lots of money.” — Liam Moroney “It is not because you're bad at sales and marketing or you're some kind of a sales and marketing genius. It's because the category is either growing or shrinking.” — Dale W. Harrison Resources & Mentions - How Brands Grow, and the light and heavy buyer model - Andrew Ehrenberg's original work and the Ehrenberg-Bass Institute - Share of search data for the social media management category, including Buffer, Hootsuite, Sprout Social and Sprinklr - Sprout Social's quarterly earnings reports - Hightouch and the CDP category - The 95:5 rule and the NBD model of purchase frequency - The bowtie model Next Episode TBC Subscribe & Follow Catch every episode of B2B Effectiveness: Evidence-Based Marketing Ideas for B2B Practitioners on your favorite podcast platform, and subscribe here on YouTube for future episodes. #B2BMarketing #ShareOfSearch #MarketingEffectiveness #BrandMarketing
8 Oct 2026
You Cannot "Work Backward From Success" | B2B Effectiveness - Episode 13
Most marketing teams can tell you what their best customers have in common. Very few can tell you how those customers differ from the ones they lost — and that second question is the only one that carries any information. Looking at your winners in isolation is, as Dale W. Harrison puts it, probably the single biggest failure point in marketing's attempt to use data. In Episode 13, Dale W. Harrison and Diego Sosa take on the habit of working backward from success. They cover lookalike lists that could just as easily have been built from your losing accounts, a vendor report that mistook a company-page visit for a revenue signal, why a random number generator matched an elaborate lead scoring system, how averages hide your losses, and why LinkedIn-influenced pipeline says more about the platform's incentives than about your buyers. Timestamps 0:32 Back for another episode — Diego, a split of three 1:16 This week's topic: differences, not similarities 1:35 Why working backward from success is marketing's biggest failure point 2:21 The classic example: target account and lookalike lists 3:23 Diego: the same reasoning in the signal debate 4:16 The attribution report and the LinkedIn company page 4:58 The question nobody asked: what about closed-lost? 5:51 Vowels in your name — a 100% correlation 6:47 Diego: when a data point actively misleads you 7:58 The number was right. The conclusion was wrong. 8:24 Why “data-driven” is a warning sign 9:00 Data is the bucket, not what's in it 9:16 Points-based lead scoring counts buckets 10:04 The roulette wheel: lots of data, no information 10:40 Decisions as discrimination between options 11:36 What an MQL actually is 13:33 Zoho's lead scoring versus a random number generator 15:28 Diego: information as the reduction of uncertainty 16:05 Betting under uncertainty: the coin toss 17:18 Beating a random pull from ZoomInfo 17:53 Two slot machines that look identical 19:22 A flawed sales-cycle analysis from a RevOps podcast 20:20 Measure against your opposite, not your average 21:39 What is your average actually averaging? 23:05 Diego: averages and non-normal distributions 24:02 Why we do it: “I blame it on martech” 24:25 Dashboards full of dancing monkeys 25:04 LinkedIn-influenced pipeline 26:10 Closed-lost deals get more engagement 27:38 The foundational question: compared to what? 28:41 Diego: touch the whole market, count only the winners 30:45 Grading their own homework 31:00 Not accidental: incentives behind the dashboards 31:47 LinkedIn's own advice on company pages 32:51 The dashboard, the CFO and your credibility 34:02 Two key questions for every piece of data 34:35 Why common characteristics mean nothing 35:50 The value of uncommon characteristics 37:11 What AI gets wrong when it mines your CRM 38:04 Diego: put in the dirty work and test the platforms 38:55 Be driven by information, not data 41:15 One article, ten articles, a hundred articles 42:41 Diminishing returns on every additional data point 44:35 Diego: gaming engagement scores 45:33 Driving people through the company page 45:58 Ice cream sales and drownings 46:25 Lead nurturing and the evil genius 47:06 Wrapping up Key Topics Discussed - Why a description of your winners contains no usable information on its own - Lookalike and target account lists, and what happens when your losers look the same - Revenue signals that look strong among closed-won deals and are stronger still among closed-lost - Data versus information: information is whatever reduces your uncertainty - Marketing decisions as discrimination, and the random number generator as the benchmark to beat - How averages hide your losses — and what “average revenue per deal” usually leaves out - LinkedIn-influenced pipeline and the incentives behind martech dashboards - Why AI tends to surface common characteristics, and why uncommon ones carry the signal - Diminishing returns: why the hundredth data point tells you almost nothing new Notable Quotes “Data is not what should be driving your decisions. Information should be doing it.” — Dale W. Harrison “The number was right, but the conclusion was completely wrong.” — Diego Sosa “If all you do is keep a tally of all your wins, the two slot machines look identical.” — Dale W. Harrison “Data is not the problem. It's just that it shouldn't be your stopping point. It should be a starting point for you.” — Diego Sosa Resources & Mentions - A marketing attribution vendor's report on LinkedIn company page visits among closed-won accounts - Zoho CRM's RevOps test of lead scoring against randomly selected leads - LinkedIn's own marketing guidance on investing in company pages - LinkedIn-influenced pipeline reporting - Previous episodes in this series on why information is not data Next Episode “What does Brand-Aware Search Actually Measure?” Subscribe & Follow Catch every episode of B2B Effectiveness: Evidence-Based Marketing Ideas for B2B Practitioners on your favorite podcast platform, and subscribe here on YouTube for future episodes. #B2BMarketing #MarketingAnalytics #RevOps #MarketingAttribution
1 Oct 2026
How To Measure Sales Effort - Or Where's The Sandbagging? | B2B Effectiveness - Episode 12
Ask a revenue operations team how long the average deal takes to close and you will get an answer. Ask how long it takes to lose one and the room goes quiet. In most organisations it is three times longer — and across roughly 90% of the companies Dale W. Harrison has examined, somewhere between three and seven times longer. That gap is not a quirk of the reporting. It is the reporting being wrong, in ways that flow into every other number on the dashboard. In Episode 12, Dale W. Harrison and Diego Sosa take on sales effort — the input that pipeline velocity, cost per acquisition and segment efficiency all depend on, and the one number in the CRM that can be 700% wrong. They cover why dead accounts stay on the books, how a maintenance drip feed exposes a rep who has already given up, why deals held out of the system make your win rates look spectacular, and how to read a win-rate chart without drawing exactly the wrong conclusion from it. Timestamps 0:30 Back for another episode — Diego standing in again 0:52 Where sales effort sits inside the Buyer-Seller Fit Model 1:08 The metric that never appears on a dashboard but feeds most of it 2:44 The traditional proxy: days active in the CRM 3:29 The perfect measure nobody will ever build — a 24/7 rep diary 4:20 Not 10% wrong. 700% wrong. 4:59 Data is not information: context is what creates meaning 5:45 Diego on the rep's own incentive to make the data look good 6:50 High-side and low-side errors, often in the same organisation 8:17 The one metric Dale has never seen a rev ops team produce 9:08 Why it takes three times longer to lose a deal than to win one 9:48 90% of companies land between 3x and 7x 10:10 Zombie accounts, and why reps keep touching them 10:54 The never-say-die rep — and why you want that instinct 12:38 Diego: conversion rate as a quarterly performance measure 13:30 Pipeline value, bragging rights and adverse incentives 16:52 The maintenance drip feed 17:16 Plausible deniability: “still, quote, working the account” 18:18 “Nobody is going to tell you I'm sandbagging my numbers” 18:21 Diego: when does a rep actually create the deal? 18:50 Low-side errors: 80% of the work done before it hits the CRM 20:23 CRM discipline, and the trigger point that forces a deal into the system 22:36 Diego: why effectiveness collapses if this number can't be trusted 23:30 What an ICP should actually be 24:17 Biotech: a P-card in a university lab versus three months with Pfizer 27:26 Deal value and win rate are unambiguous. Sales effort is not. 28:29 Diego: the slot machine, and treating accounts as a portfolio 30:01 Why optimising for a single metric produces confidently wrong answers 31:41 Bureaucratic inertia on the buyer side, and what you cannot control 33:44 Real sales data, across multiple years, from a real company 34:11 Activity density explained 35:36 The unweighted activity measure, and the fallacy inside it 37:01 Reading the chart: 4.5% at one end, 82.1% at the other 38:24 The same mistake everybody makes with lead scoring 39:09 Why the 24% bar is the honest one 40:01 Wittgenstein's ruler: is the win rate real, or is the data wrong? 40:49 Late entry, and the burst of activity around a priced proposal 42:20 The 4.5% end: stretching a deal that is already lost 43:28 Two touches a month is not a pipeline, it is cover 45:18 Both distortions running inside one sales organisation 45:53 Backing it out: weighted activity and days with activity 47:59 The 97% rule and the 81-day cutoff 49:10 Run it weekly, and close by default 50:26 Why the true believers are the more expensive problem 52:15 Diego: using data to raise better questions 53:30 What AI lacks is the context around the process that made the data 54:25 The real danger: turning your brain off and outsourcing the thinking 55:23 Multiple versions of the world, one set of data Key Topics Discussed - Days active as a proxy for sales effort, and why the error can reach 700% rather than 10% - The closed-won to closed-lost ratio: a five-minute calculation almost no rev ops team runs - Zombie accounts, and the difference between a true believer and a rep buying cover - Adverse incentives that appear even when management never mentions the numbers driving them - Low-side errors: deals held out of the CRM until the outcome is already clear - Wittgenstein's ruler applied to a win-rate chart — measuring the table, or testing the ruler - Why the middle of the distribution is usually the honest part of it - Better proxies: weighted activity, days with one or more activities, and weighted days - The 97% rule: closing zombie deals by default and making the rep argue to keep them open Notable Quotes “This metric, this proxy for sales effort, can be massively wrong. And when I say massively, I mean not 10% wrong — I'm talking about like 700% wrong.” — Dale W. Harrison “There's nobody is going to tell you I'm sandbagging my numbers.” — Dale W. Harrison “I'm also not incentivized, so to speak, to represent my work as directly relatable to reality, but just in the way that I can look better for my manager.” — Diego Sosa “If you do not know the context that created your data, then you have no idea what the data means.” — Dale W. Harrison Resources & Mentions - Gartner B2B sales funnel benchmark data - Win rate against activity density — several years of anonymised CRM data from a single company - Activity data pulled from HubSpot; the same analysis runs on Salesforce or any other CRM - The Buyer-Seller Fit Model, covered across this series Next Episode Back next week, including a closer look at weighting activity data by the effort each activity actually represents. Subscribe & Follow Catch every episode of B2B Effectiveness: Evidence-Based Marketing Ideas for B2B Practitioners on your favourite podcast platform, and subscribe here on YouTube for future episodes. #B2BMarketing #DemandGeneration #RevOps #MarketingAnalytics
24 Sept 2026
The Buyer-Seller Fit Model - A Technical Dive into Lead Scoring | B2B Effectiveness - Episode 11
HubSpot holds roughly 7% of the CRM market. Inside the Fortune 1000 it holds 0.4%, while Salesforce holds about 85%. Same category, same buyers on paper, and a gap that has almost nothing to do with product quality — large companies are averse to buying from small ones, and small ones would rather not be Exxon's smallest account. No volume of intent data will ever tell you that. In Episode 11, Dale W. Harrison goes solo for the most technical instalment of the series so far, opening up the back end of the Buyer-Seller Fit Model. He covers why the team committed to a glass box rather than a black box; why nobody above sales and marketing cares about your close rate; the vowels-in-the-name problem sitting inside every lookalike list ever built; and the maths that turns a CRM full of wins and losses into a ranked view of where sales effort actually pays. Timestamps 0:23 Solo episode this week — no co-host 0:33 Why this one is a technical dive into the Buyer-Seller Fit Model 1:43 Glass box, not black box: why you should be able to see the working 3:32 Defining buyer-seller fit 3:54 HubSpot vs Salesforce: 7% of the market, 0.4% of the Fortune 1000 5:58 The biotech example: same product, completely different customers 9:05 The CFO's black box 10:40 Nobody at corporate level cares about your closed-won rate 11:15 The 20% benchmark, and paying for the 80% you lose 13:45 Siloed ICPs and the 100 dream accounts problem 14:59 “They will, in fact, crush your dreams” 17:31 The vowels-in-the-name fallacy 18:35 Lead scoring and MQL designation 19:36 25 years of intent data, and a process that fails 99% of the time 20:21 There is no such thing as intent data 22:46 HubSpot's scoring model: 90% made-up intent, 10% firmographic fit 23:46 Sales effort, and why it dwarfs what marketing spends 26:32 Why pipeline velocity on its own tells you nothing 28:47 Slot machines, not vending machines 31:31 One unified model, from ICP through to sales allocation 33:05 Why great reps can smell a win 36:05 Unicorns, goats, whales and workhorses 39:21 The maths: mismatched units, benchmarks and log efficiency space 45:40 Beyond industry: revenue band, headcount, geography and tech stack 49:14 Reading the output: the efficiency and scale quadrant 57:56 Why no AI model can show you its work 1:05:17 Whatever you were bad at last quarter, you're still bad at Key Topics Discussed - Glass box versus black box: why a model you cannot audit is a commercial risk, not just a technical one - Buyer-seller fit as two separate questions — will they buy from someone who looks like you, and are you equipped to sell to someone who looks like them - Why the business cares about revenue per unit of sales effort, not close rate, deal size or pipeline velocity in isolation - Paying for your losses: any honest model has to account for the 80% of deals that produce no revenue - The vowels-in-the-name problem: why a lookalike list built only from closed-won data carries no information - What intent data actually measures, and why digital touchpoint data is not intent - Unicorns, goats, whales and workhorses: separating sales efficiency from commercial scale - Closing the loop: one model running from ICP definition through campaign targeting, lead scoring and sales resource allocation Notable Quotes “Just because someone is buying something that looks like what you sell doesn't mean they will ever buy from you. And just because they're potentially willing to buy from you doesn't mean you're really prepared to sell to them.” — Dale W. Harrison “Your guesses, and your hopes and wishes are not the same thing as an evidence-based approach.” — Dale W. Harrison “Just because someone is showing intent doesn't mean they're showing intent toward you. Nor will they ever show any intent toward you.” — Dale W. Harrison Resources & Mentions - Gartner B2B sales funnel benchmark data - HubSpot and Salesforce Fortune 1000 market share data - Slide deck from this episode — link to follow in the comments Next Episode Back next week with more on the buyer-seller fit model. Subscribe & Follow Catch every episode of B2B Effectiveness: Evidence-Based Marketing Ideas for B2B Practitioners on your favourite podcast platform, and subscribe here on YouTube for future episodes. #B2BMarketing #DemandGeneration #LeadScoring #MarketingAnalytics
17 Sept 2026
The Buyer-Seller Fit Model - What is it & How to Measure it | B2B Effectiveness - Episode 10
Twenty years ago, Dale W. Harrison built a system that de-anonymized roughly 90% of website traffic down to a named individual, then checked his scoring model against what actually happened next. The result: each of his two buckets — “likely to buy” and “not likely to buy” — was only about 60% correct. A small, genuine improvement over a coin flip, not the confident precision the intent data industry has been selling ever since. In Episode 10, Diego Sosa joins Dale again for the most detailed breakdown yet of what should actually replace the broken MQL. They cover why you don't need to know why something works, only that it reliably does; the two-sided idea of buyer-seller fit; why thinking in slot machines beats thinking in vending machines; and why the data you need has been sitting in your CRM the whole time. Timestamps 0:00 Cold open: intent data vendors are lying to you 0:20 Welcome back 0:33 Setting up today's topic: what replaces the old lead scoring model 2:53 20 years, still a 99%+ failure rate 5:34 It's just a slot machine, not a vending machine 6:07 Causality without correlation: the biotech and drug analogy 6:47 Viagra vs. antidepressants: two kinds of “we don't know why it works” 9:16 Defining buyer-seller fit 9:50 HubSpot vs. Salesforce in the Fortune 1000 10:39 Why Exxon won't buy from a six-month-old company 11:13 Seller fit: the biotech researcher-vs-government-lab example 17:26 Thinking in slot machines, not vending machines 19:32 The ROAS story, and “this is where marketers get stupid” 21:55 Why win rate and sell cycle are both the wrong things to optimise 23:27 Rolling buyer fit and seller fit into one metric: revenue per unit of sales effort 44:06 The Pampers analogy: reverse-engineering demographic targeting 47:26 Why the data you need is already sitting in your CRM 48:15 The vowels-in-the-name story, one more time 50:35 Diego's first sales job, and the deals that looked too easy 52:26 The notion of opportunity cost 55:48 Dale's own 20-year-old experiment: de-anonymizing 90% of traffic 59:47 Click monkeys, and the people who show up ready to buy with no warning 1:01:00 Naming it: Dark Social Key Topics Discussed - Why you don't need to know why something works, only that it reliably correlates with the outcome - Buyer-seller fit: why it's not enough that a buyer would buy from you — your sales team has to be equipped to close them too - The HubSpot vs. Salesforce Fortune 1000 gap, and why tenure and trust matter more than product quality - Thinking in slot machines: why win rate and payout size can't be judged in isolation - Why win rate and sell-cycle length are both the wrong things to optimise for - Revenue per unit of sales effort: the one metric that rolls buyer fit and seller fit together - Reverse-engineering targeting from your own CRM data instead of buying generic intent scores - Click monkeys and dark social: the two failure patterns any real scoring model has to account for Notable Quotes “What we're really looking at here are slot machines, not vending machines.” — Dale W. Harrison “You cannot work backwards from success. You have to look at how the winners are different from the losers, not how the winners are similar to one another.” — Dale W. Harrison “Three minutes on the phone with someone will give you more information than 1,000 touch points from your intent data provider.” — Dale W. Harrison Resources & Mentions - Gartner B2B sales funnel benchmark data - HubSpot and Salesforce Fortune 1000 market share data Next Episode Back next week with more detail on the buyer-seller fit model. Subscribe & Follow Catch every episode of B2B Effectiveness: Evidence-Based Marketing Ideas for B2B Practitioners on your favourite podcast platform, and subscribe here on YouTube for future episodes. #B2BMarketing #DemandGeneration #LeadScoring #MarketingAnalytics
10 Sept 2026
Data Does Not Equal Information - and AI Is Not The Solution | B2B Effectiveness - Episode 9
For roughly five hundred years, bloodletting with leeches was standard medical treatment — and even decades after doctors realised it was probably killing people, they kept doing it, because patients demanded it. That's Dale W. Harrison's analogy for the intent data industry today: happy customers and glowing reviews that prove nothing about whether the product actually works. This week, Diego Sosa joins Dale in Liam Moroney's usual seat for a deep, methodical breakdown of the idea the show keeps returning to: data is not information. Diego and Dale walk through why ten ebook downloads don't mean ten times the certainty, the name-tags-at-a-networking-event analogy for how information actually works, and why nobody in the intent data industry has ever produced a single graph proving their product does what it claims. Timestamps 0:00 Cold open: data is not information 0:26 Welcome back, with a new guest in Liam's seat 0:34 Meet Diego Sosa 1:08 The core question: why do we think more data is the answer? 2:07 What “information” actually means 6:59 The ebook download example, and why more never means better 8:18 Why marketers keep falling for this anyway 14:22 Nate Silver's The Signal and the Noise, and rebranding touch points as signals 16:06 The classic failure: intent data 20:59 A real correlation graph, built from actual sales data 21:27 The name tags analogy: how much information is really in the data 26:46 The iceberg: what you don't see still matters 27:20 Dark social, and why the two buckets end up identical 36:48 Working backwards from success doesn't work, and the measles analogy 38:44 The real closed-won vs. closed-lost numbers on LinkedIn engagement 42:07 The billboard story: proving impact without a click 44:35 The Google ads scam agencies run on branded search 46:17 Diego's first data analytics job, and asking the question before the data 48:36 Intervention vs. no intervention: the umbrella and headache examples 49:06 “They're lying to you”: why intent data doesn't exist Key Topics Discussed - Why data is not information, and why more data usually isn't more information - The ebook download example: why the information curve flattens long before the points curve does - The name tags analogy: how prior knowledge determines how much a data point can tell you - Why no intent data vendor has ever produced a real correlation graph - Working backwards from closed-won accounts doesn't work, illustrated with a measles analogy - The real numbers: closed-lost deals were more likely to visit the LinkedIn company page than closed-won deals - The billboard story, and the branded-search scam some agencies run on Google Ads accounts - Why you have to ask the question before you look at the data Notable Quotes “Data is not information. Data is a bucket. It's the bucket that information comes in.” — Dale W. Harrison “What you see is not all there is, and you don't know how much there isn't.” — Diego Sosa “They're lying to you. It's a straight lie when they tell you they're selling you intent data, because intent data does not exist.” — Dale W. Harrison Resources & Mentions - The Signal and the Noise by Nate Silver - Bombora and 6sense (intent data providers) - Forrester, Gartner, and BCG B2B benchmark data Next Episode Back next week with a new episode of B2B Effectiveness. Subscribe & Follow Catch every episode of B2B Effectiveness: Evidence-Based Marketing Ideas for B2B Practitioners on your favourite podcast platform, and subscribe here on YouTube for future episodes. #B2BMarketing #DemandGeneration #MarketingAnalytics #IntentData
3 Sept 2026
Rising/Falling Markets: Category Growth and Share of Search | Episodes 8 - B2B Effectiveness
For years, LastPass dominated the password manager category. Then it suffered a string of serious data breaches, trust collapsed, and competitors like Bitwarden absorbed the fallout. Bitwarden's marketing team could be forgiven for thinking their campaigns did that. Almost none of it was marketing. In Episode 8, Liam Moroney brings real branded-search data to back up an argument Dale W. Harrison has been building for weeks: marketing very rarely grows a business — the category does. Using a live three-slide case study of the password manager category (plus a second, more mature category for contrast), Liam and Dale walk through how to actually read share of branded search, why market share barely moves except after one of two specific shocks, and why AI is now eating entire software categories the same way email once ate the fax machine. Timestamps 0:00 Cold open: marketing doesn't grow the business, markets do 0:15 Welcome back (Dale's in the UK this week) 1:04 Setting up today's topic: rising and falling markets 2:22 Why 99.99% of growth comes from riding the category, not beating competitors 3:54 The disruption myth, and why tech clings to it 5:04 Disruption happens in engineering, not marketing 6:22 Bitcoin, NFTs, and fads that look like marketing genius 7:57 Welcome to the life of a fax machine salesman, circa 2005 9:20 Marketing automation platforms as a case study 11:06 Categories that self-disrupt through over-promising 12:37 Why intent data and de-anonymization providers are collapsing 15:16 How AI is uniquely positioned to eat interactive demo software 16:14 Liam's data: a tale of three slides (the password manager category) 17:32 Bitwarden vs. LastPass: the branded search view 19:17 What “share of branded search” actually measures 20:50 Why campaign changes show up in the data almost instantly 22:59 The LastPass data breach, and what it cost them 25:11 Defining “category”: Tide detergent vs. Tide Pods on TikTok 31:36 Dale's own hypergrowth story: 100x growth, same market share order 32:50 The collective view: how the category grew even as LastPass fell 39:09 A mature category case study: content management platforms 41:03 What an accelerating category decline looks like 43:40 Rolodexes, CRMs, and where declining categories' customers go 47:23 Optimizely's rebrand, and repositioning into an adjacent category 47:47 Why categories almost never fully vanish 57:50 The tool behind today's data, and where to learn more Key Topics Discussed - Why 99.99% of business growth comes from riding a category, not beating competitors - The disruption myth: why tech assumes a great product creates its own momentum - Fads vs. real category shifts: Bitcoin, NFTs, and fax machines - Why AI is uniquely positioned to eat categories like interactive demo software - How to actually read share of branded search as a proxy for market share - The LastPass/Bitwarden case study: a real market-share transfer, and why it wasn't about marketing skill - Why market share is remarkably sticky, and the two things that actually move it - What a declining category looks like from the inside, using a mature CMP category example Notable Quotes “Marketers live in this fantasy world where they think it's their marketing that's growing the business.” — Dale W. Harrison “You're not growing the category. This is another one of these silly myths that people love to blather on about.” — Dale W. Harrison “It is these category-level and market-level dynamics that are really driving things — the fish are jumping out of the water into the boat by themselves.” — Dale W. Harrison Resources & Mentions - Ehrenberg-Bass Institute research - Bitwarden, LastPass, 1Password, Dashlane, and NordPass branded search data - Optimizely, AEM, Contentful, and Sitecore (content management platform category) - Kantar market research - Liam Moroney's category-tracking tool (Storybook) Next Episode The show is taking a short break for the Fourth of July and the following week while Dale's still travelling in Europe — back with a new episode on the 18th. Subscribe & Follow Catch every episode of B2B Effectiveness: Evidence-Based Marketing Ideas for B2B Practitioners on your favourite podcast platform, and subscribe here on YouTube for future episodes. #B2BMarketing #BrandMarketing #MarketingStrategy #MarketingAnalytics
27 Aug 2026
A Better Lead-Scoring System Can Create Better Targeting | Episode 7 - B2B Effectiveness
Dale W. Harrison likes to run a poll: imagine a company about to sign a $5 million annual contract, renewed every year for five years. Who's on the buying committee? Most people guess the CFO, maybe the CEO. Then he reveals the deal: it's Google's contract for toilet paper in the employee restrooms. Nobody's CFO is in that meeting. In Episode 7, Liam Moroney and Dale W. Harrison flip the usual playbook: can better lead scoring actually define better targeting, instead of the other way around? Dale walks through why lookalike lists built from your closed-won accounts alone are structurally guaranteed to fail, why “buying groups” are an 80-year-old idea being resold as something new, and why the real de-anonymization numbers are nowhere near what most targeting strategy assumes. Timestamps 0:00 Cold open: massively overshooting who will buy 0:20 Welcome back, and teasing about the solo episode 1:42 Can better lead scoring define better targeting? 5:20 The feedback loop model, explained 10:56 Buying committees, and the summer intern who did the real work 15:21 The 90% de-anonymization era, and what changed 23:31 What Meta's lookalike algorithm actually does 25:07 The vowels-in-the-name story, revisited 29:12 The stock-picking sales pitch analogy 31:25 Glengarry Glen Ross, and the problem with intent 32:47 The $5 million toilet paper deal 35:38 Buying groups: a 1965 Harvard Business Review idea, not a new one 39:48 Why buying committees are confidential, and the HR risk of naming names 41:21 The real de-anonymization numbers 45:18 Reverse-engineering targeting from your own closed-won and closed-lost data 51:09 How to verify it's actually working: MQL-to-SQL rate 52:10 The slot machine analogy 54:21 Home runs vs. the Tour de France: buyer-seller fit in sports 56:47 The roulette wheel: data is not information 59:35 Seventh-grade math, and why the models aren't complicated 1:02:17 Teaser: rising and falling markets, and categories being eaten by AI Key Topics Discussed - Why lead scoring data should define targeting, not just measure it after the fact - How lookalike-list algorithms actually work, and why they keep pointing at your losses too - Why “buying groups” are an 80-year-old idea, not a new market shift - Why buying committees are treated as confidential, and what happens if you name one publicly - The real de-anonymization numbers: ~65% at the account level, 5–7% for named individuals - Working backwards from your own closed-won and closed-lost history instead of guessing - How to verify a scoring improvement is real: tracking MQL-to-SQL acceptance rate - Why data is not information, illustrated with a roulette wheel Notable Quotes “The perfect lookalike list would be for us to go out and find more prospects that also have vowels in their name.” — Dale W. Harrison “Data is not information. Data is the bucket that information comes in.” — Dale W. Harrison “If you have two slot machines, and one pays off one out of a hundred pulls, and one pays off one out of fifty pulls, which one do you want to put your money in?” — Dale W. Harrison Resources & Mentions - Gartner B2B sales funnel benchmark data - Harvard Business Review, 1965 article on buying committees - 6sense and Bombora (intent data providers) - Ocean.io (lookalike list provider) Next Episode Next week, Dale and Liam get into rising and falling markets — why a category being quietly “eaten alive” can mean there's no one left in-market at all, no matter how good your targeting is. Subscribe & Follow Catch every episode of B2B Effectiveness: Evidence-Based Marketing Ideas for B2B Practitioners on your favourite podcast platform, and subscribe here on YouTube for future episodes. #B2BMarketing #DemandGeneration #LeadScoring #ABM #MarketingAnalytics
20 Aug 2026
The Next-Gen MQL | Episode 6 - B2B Effectiveness
Take every account your company has ever closed-won, upload the list to an ad platform, and ask it to find more companies that look just like them. Here's the uncomfortable part: every one of those accounts almost certainly has vowels in its name too. That's the opening argument in this solo episode, where Dale W. Harrison lays out why most B2B lookalike modelling, lead scoring, and “intent data” never actually worked — and introduces the framework The Insight Collective is calling the NextGen MQL. With co-host Liam Moroney away this week, Dale walks through the real original sin of lead scoring (mistaking a pattern for a signal), why “data is not information,” and a three-part model — category expansion, buyer-seller fit, and firmographic customer lifetime value — that scores leads on probability and expectation value instead of invented point totals. Timestamps 0:00 Cold open: marketing is a slot machine, not a vending machine 0:14 Welcome to a solo episode 1:15 Why the MQL still matters 1:45 The flat tyre analogy, again 2:04 The real question: what's worth a sales investment 6:47 The ABM buying-committee fantasy 9:09 The vowels-in-the-name story 9:52 Lead scoring's original sin: subjective, made-up numbers 13:24 Where HubSpot's scoring framework gets it half right 17:15 In an ideal world, what should an MQL mean? 18:20 Buyer fit vs. seller fit 20:58 Customer value fit 26:14 The blood test analogy: data isn't information 27:12 What can we actually know: broad ICP fit 29:29 Why in-market fit is nearly impossible to detect 32:59 Marketing is poker, not chess 39:47 The 95-5 rule, and when it breaks 41:17 The three-part NextGen MQL model 46:25 Vector modelling and buyer-seller fit 50:35 Firmographic CLTV 52:33 Expectation value scoring 55:55 Glass box vs. black box models 58:11 Where to learn more Key Topics Discussed - Why the MQL is a structural necessity, not a fad, in any business with a separate sales function - The vowels-in-the-name story: why a pattern in your closed-won accounts can be meaningless - Lead scoring's original sin: treating engagement data as if it were intent - Why “data is not information,” illustrated with a blood test analogy - Buyer fit, seller fit, and why sales teams are better suited to some accounts than others - Customer value fit: scoring for lifetime value, not just the next closed-won deal - Why marketing is poker, not chess — thinking in bets instead of certainties - The 95-5 rule, and why it breaks down in fast-growing categories - The three-part NextGen MQL model: category expansion, buyer-seller fit, and firmographic CLTV - Expectation value scoring: replacing invented point totals with real probability and value - Why a “glass box” model beats a black-box AI score every time Notable Quotes “The most reliable predictor of what you'll find if you look at closed-won accounts is that every one of these accounts has vowels in their name.” — Dale W. Harrison “Data is not information. Data is the bucket that information comes in.” — Dale W. Harrison “You're playing poker. Decisions have to be made with incomplete information, hidden variables, and luck. A good decision can lose, and a bad decision can win.” — Dale W. Harrison Resources & Mentions - Gartner B2B sales funnel benchmark data - Forrester and BCG B2B benchmark data - HubSpot lead scoring framework - 6sense and Bombora (intent data providers) - The Insight Collective's NextGen MQL framework Where to Learn More If you'd like a copy of the presentation deck, want early access to the NextGen MQL, or have any questions, reach out to Dale W. Harrison directly — by email or by DM on LinkedIn. Subscribe & Follow Catch every episode of B2B Effectiveness: Evidence-Based Marketing Ideas for B2B Practitioners on your favourite podcast platform, and subscribe here on YouTube for future episodes. #B2BMarketing #DemandGeneration #LeadScoring #MQL #MarketingAnalytics #ABM
13 Aug 2026
"The ICP" is Not Necessarily Your ICP | Episode 5 - B2B Effectiveness
Run the numbers on almost any B2B company's accounts, and a strange pattern shows up: the top 10% of your top 20% highest-revenue accounts tend to be your absolute lowest-profit accounts. They cost a fortune to land, a fortune to service, and know they can make unreasonable demands you can't refuse. In Episode 5, Liam Moroney and Dale W. Harrison take on Ideal Customer Profile — why most B2B “dream account” lists are built on a B2C-shaped mistake, why buyer-seller fit has to work in both directions, and why you can't just hire your way into a new market. Dale also lays out the layered framework the series has been building toward: broad ICP fit, in-market fit, consideration set eligibility, conditional win probability, and CLTV. Timestamps 0:00 Cold open: your best accounts might be your worst 0:18 Welcome back 0:35 Setting up today's topic: ICP 1:19 The marketing guru who couldn't define ICP 2:12 What ICP means in B2C vs. B2B 3:37 Your “dream accounts” list, and the Swedish supermodel problem 5:24 Why B2B buyers prefer buying from other large companies 5:56 HubSpot vs. Salesforce, and the Fortune 1000 problem 12:35 Defining buyer-seller fit 13:20 Why sales teams develop lopsided skills (“leg day, arm day”) 16:22 The rep who could only sell to banks 17:12 The distributor rep who only sold refrigerators 19:53 Can you just hire your way into a new market? 21:22 The Salesforce 15-person team story 26:19 The sober reality, and how to be more optimistic about it 33:29 Brand marketing's slow payoff vs. today's performance needs 40:37 Consideration set eligibility and conditional win probability 41:34 The Apollo moon suit story 44:14 Highest CLTV expectation value 51:08 Market orientation, and grounding leadership in reality 55:22 How static is an ICP, really? 57:14 Why relative market share barely changes over time Key Topics Discussed - Why B2C-style ICP thinking breaks down in B2B - The “dream accounts” problem: wanting a buyer isn't the same as being wanted back - Why the Fortune 1000 almost never buys from the smaller player, no matter the product - Buyer-seller fit: why sales teams get good at selling to some accounts and bad at others - Why hiring experienced enterprise sellers rarely fixes a buyer-seller fit problem on its own - The Apollo moon suit story: when the best product and the best seller are two different companies - The five-layer framework: ICP fit, in-market fit, consideration set eligibility, conditional win probability, and CLTV - Why relative market share is remarkably stable, even in fast-growing categories Notable Quotes “Your dream accounts are the accounts you're dreaming of selling to, but it's not necessarily the accounts that are interested in buying from you.” — Dale W. Harrison “For most sales teams, it's like every day is leg day, or every day is arm day at the gym. And you end up with some pretty distorted-looking physiques as a result.” — Dale W. Harrison “It has to be a buyer who is likely to buy from someone who looks like you, and it has to be a buyer that your sales organisation has a reasonably good chance of selling to.” — Dale W. Harrison Resources & Mentions - Gartner and Boston Consulting Group B2B benchmark data - Ehrenberg-Bass Institute research - HubSpot, Salesforce, Zoho, and Pipedrive market share data Next Episode Next week, Dale goes solo to get into the messy technical details of what building this kind of scoring system actually looks like in practice. Subscribe & Follow Catch every episode of B2B Effectiveness: Evidence-Based Marketing Ideas for B2B Practitioners on your favourite podcast platform, and subscribe here on YouTube for future episodes. #B2BMarketing #DemandGeneration #ICP #MarketingStrategy #MarketingAnalytics
6 Aug 2026
Rising Markets Break the 95:5 Rule | Episode 4 - B2B Effectiveness
The 95-5 rule is one of B2B marketing's favourite soundbites: at any given moment, only 5% of your market is in-market to buy. It gets cited as settled fact in board meetings and budget arguments — and in most fast-growing B2B tech categories, it's wrong by a factor of five or more. In Episode 4, Dale W. Harrison and Liam Moroney unpack where the 95-5 rule actually comes from, the hidden assumption almost nobody repeating it seems to know about, and why growing or shrinking markets break it completely. Dale also takes aim at the famous Binet and Field 50-50 brand/performance split, explains why roughly 70% of billion-dollar tech companies never ran a single brand ad, and walks through exactly when brand marketing does and doesn't earn its keep. Timestamps 0:00 Cold open: most tech companies grow because the category grows 0:13 Welcome back 0:50 Setting up today's topic: the 95-5 rule 2:29 What actually is a “category”? 4:10 The jobs-to-be-done model 5:06 What the 95-5 rule actually says 6:23 Andrew Ehrenberg's NBD model of purchase frequency 7:39 The hidden assumption: stationary markets only 14:50 The iPod launch: 100% first-time buyers 17:39 The CRM market: doubling in size, and what that implies 20:55 Liam's brand-tracking data: declining search volume 24:21 Speaking of math: walking through the numbers 27:06 The Binet and Field research, and its selection bias problem 30:46 70% of billion-dollar tech companies never ran a brand ad 32:18 Supermarket brands that have never advertised 36:00 “You don't need to bait the hook if the fish are jumping in the boat” 41:23 Home exterminators: brand marketing done right 42:19 DUI attorneys: the most precisely targeted marketing on earth 44:34 The physics analogy: F = ma, and gravity on the Moon vs. Earth 55:05 Wrapping up Key Topics Discussed - What actually defines a “category,” and why so many marketers get it wrong - Where the 95-5 rule comes from: Andrew Ehrenberg's NBD model of purchase frequency - The hidden assumption behind the rule: it only holds in stationary markets - Why growing markets can push the in-market rate from 5% to 25% or more - The selection bias hiding inside the famous Binet and Field brand/performance split - Why 60–80% of supermarket brands have never run a single ad - Exterminators vs. DUI attorneys: when brand marketing actually earns its keep - Why the 95-5 rule is a baseline, not a universal law — and what that means for lead scoring Notable Quotes “You don't need to bait the hook if the fish are jumping out of the water directly into the boat.” — Dale W. Harrison “Gravity on Earth is completely different than gravity on the Moon, which is completely different than gravity on Jupiter. That doesn't mean physics doesn't exist.” — Dale W. Harrison “They want to expose themselves to potential buyers as close to the moment they get arrested as possible, so that they'll hopefully be remembered when they get to jail.” — Dale W. Harrison Resources & Mentions - Andrew Ehrenberg's NBD model of purchase frequency - Les Binet and Peter Field's brand/performance research - CRM market growth data (Salesforce) Next Episode Dale and Liam are opening up the floor: if there's a topic related to MQLs, lead scoring, or getting leads into the hands of sales that you'd like covered, drop it in the comments — it'll show up in a future episode. Subscribe & Follow Catch every episode of B2B Effectiveness: Evidence-Based Marketing Ideas for B2B Practitioners on your favourite podcast platform, and subscribe here on YouTube for future episodes. #B2BMarketing #DemandGeneration #BrandMarketing #MarketingStrategy #MarketingAnalytics
30 Jul 2026
Your Lead Scoring is Completely Broken! | Episode 3 - B2B Effectiveness
Imagine a medical test that tells a patient they have cancer, but is wrong 19 times out of 20. No regulator would ever allow it near a hospital. Yet for roughly twenty years, that's been about the accuracy of the average B2B lead scoring system — long-running Gartner benchmark data puts MQL acceptance rates by sales at around 5–6%. In Episode 3, Dale W. Harrison and Liam Moroney dig into why every proposed fix for the MQL — MQAs, AI-qualified leads, more signals, better points — keeps the exact same broken scoring math in place. Dale explains why data is not information, why patterns that show up equally in your wins and your losses tell you nothing, and why any real qualification system has to measurably beat a coin flip — something most lead scoring never actually does. Timestamps 0:00 Cold open: the failed system, guaranteed 0:30 Welcome back 0:52 Why this topic is personal for Dale 3:31 The Gartner benchmark: 5-6% MQL acceptance rate 4:39 The false positive problem, explained 5:24 The cancer test analogy 12:20 Data is not information 17:53 Liam pushes back: doesn't more signal data help? 21:49 The false negative problem 23:06 Measuring both false positives and false negatives 24:14 SQOs, and the click monkeys who ruin every model 27:03 Dark social: invisible engagement 32:48 The Harry Potter sorting hat problem 33:44 Thinking in bets, revisited 35:35 MEDDIC, BANT, and why checklists don't help 35:51 The buyer is scoring you too 37:47 The parallel universe you can't see 40:11 Why identical products can have wildly different close rates 44:24 Liam's camera store story 47:03 Teaser: how growing markets break the 95-5 rule Key Topics Discussed - Why every proposed MQL replacement keeps the same broken points-based math - The cancer test analogy: why a 5% accuracy rate would never pass regulatory approval - Why data is not information, and why more signals make the problem worse, not better - Why a pattern has to differ between closed-won and closed-lost to mean anything - Measuring false negatives as well as false positives, and the “click monkey” problem - Dark social: why the best buyers sometimes show zero digital engagement - Why MEDDIC and BANT don't solve the qualification problem on their own - The buyer is scoring the vendor too — and most of their signals are invisible to you - Why identical products can have wildly different close rates depending on who's selling them Notable Quotes “No matter how you choose your signals, how you weight the signals, or how you gather up the signals, the moment you start adding up your data points, you have a fundamentally failed system.” — Dale W. Harrison “Data is not information. Data is the bucket that information came in.” — Dale W. Harrison “Just because there's something that characterises all of the closed-won deals doesn't mean that same thing doesn't also characterise all the closed-lost deals.” — Dale W. Harrison Resources & Mentions - Gartner B2B sales funnel benchmark data - MEDDIC and BANT sales qualification frameworks - Mark Ritson (marketing commentator and academic) Next Episode In Episode 4, Dale and Liam take a detour that turns out to matter more than it sounds: how rising and falling markets break the well-known 95-5 rule — not by a little, but massively. Subscribe & Follow Catch every episode of B2B Effectiveness: Evidence-Based Marketing Ideas for B2B Practitioners on your favourite podcast platform, and subscribe here on YouTube for future episodes. #B2BMarketing #DemandGeneration #LeadScoring #MQL #MarketingAnalytics
23 Jul 2026
What Would a New MQL Have to Look Like? | Episode 2 - B2B Effectiveness
A B2B SaaS company once found that accounts on Amazon FBA generated ten to twenty times more lifetime value than accounts on Etsy or eBay — even though the sales effort to close either one was statistically identical. If your lead qualification can't tell the difference between those two prospects, what exactly is it qualifying them for? In Episode 2, Liam Moroney and Dale W. Harrison move from last episode's argument — the MQL is a structural necessity, not a fad — into the harder practical question: what would a good MQL actually need to know? Dale lays out five distinct things a useful qualification should answer (broad ICP fit, in-market fit, consideration set eligibility, conditional win probability, and lifetime value fit), explains why checklist frameworks like MEDDIC don't solve the problem, and makes the case for thinking in bets instead of chasing false certainty. Timestamps 0:00 Cold open: what a good MQL should tell you 0:24 Welcome back (and a smart home tangent) 0:58 Recap: last week's argument that the MQL isn't dead 2:04 Why marketing can never know for certain 4:33 Thinking in Bets: the book behind the mental model 16:18 Why the MQL gets so politically corrupted internally 18:49 The poker analogy: raise, fold, or walk away 21:03 Why hand raisers are a better bet, not a sure one 26:28 Thinking in bets, applied to poker itself 31:31 Broad ICP fit vs. in-market fit 31:52 The fantasy of intent data, and the 95-5 rule 32:29 Why MEDDIC-style checklists don't solve this 34:55 Hand raisers, revisited 41:56 HubSpot vs. Salesforce: the Fortune 1000 problem 43:15 Conditional win probability 46:13 Lifetime value fit 47:01 The Amazon FBA vs. Etsy story 49:07 The five things a useful qualification needs to know 1:00:27 Why tweaking HubSpot's scoring system won't fix it 1:00:47 Teaser: Episode 3, why your lead scoring is broken Key Topics Discussed - Why a good MQL is a bet, not a certainty - The five things a useful qualification needs to answer: broad ICP fit, in-market fit, consideration set eligibility, conditional win probability, and lifetime value fit - Why checklist frameworks like MEDDIC don't solve the qualification problem - The procurement bid-padding story: why every box can be ticked and the deal still isn't real - Why hand raisers are a better bet than cold outbound, but still not a sure thing - The HubSpot vs. Salesforce Fortune 1000 example, and why market fit matters - The Amazon FBA vs. Etsy lifetime value story - Thinking in bets: why a good decision can still lose, and a bad decision can still win Notable Quotes “A good MQL should tell you what's the likelihood of taking this name and putting it into a sales process and getting a good return on that investment.” — Dale W. Harrison “A good decision can still lose, and a bad decision can still win.” — Dale W. Harrison “Just because you're a hand raiser doesn't mean there is a single iota of actual buying intent there.” — Dale W. Harrison Resources & Mentions - Thinking in Bets (book) - MEDDIC sales qualification framework - Gartner B2B sales funnel benchmark data - HubSpot and Salesforce market share data Next Episode In Episode 3, Dale and Liam dig into why your lead scoring is broken — the specific things that are guaranteed not to work, and what a better approach actually looks like. Subscribe & Follow Catch every episode of B2B Effectiveness: Evidence-Based Marketing Ideas for B2B Practitioners on your favourite podcast platform, and subscribe here on YouTube for future episodes. #B2BMarketing #DemandGeneration #LeadScoring #MQL #MarketingAnalytics
16 Jul 2026
The MQL is NOT Dead! | Episode 1 - B2B Effectiveness
“The MQL is dead” has been a B2B marketing clickbait headline for a decade. This episode makes the contrarian, evidence-based case that it never actually died — it just never worked the way we scored it. Liam Moroney sits down with data-driven marketing strategist Dale W. Harrison to unpack why the entire industry conflated engagement data with intent data, the infamous story of a RevOps team who proved their lead scoring model performed no better than a random number generator, and why more data almost never means more information. They close with a reframe: MQL scoring isn't about certainty — it's about improving your odds. Timestamps 0:00 Cold open: “The sales team needs leads” 0:36 Welcome back after a year off 1:04 Is the MQL dead, or just pining for the fjords? 3:55 A brief history of the MQL, from Glengarry Glen Ross to SiriusDecisions 6:55 The Zoho CRM random-number-generator story 8:12 The “original sin”: engagement data isn't intent data 9:38 The ebook-download absurdity 13:09 What Gartner's benchmark data actually shows 16:10 Why sales just wants better odds, not certainty 17:18 The lead-nurturing “goose” and the ice-cream-stand fallacy 24:16 HubSpot vs. Salesforce: why market share changes everything 27:57 The ABM challenge: should marketing target accounts, not leads? 34:08 Data isn't information: the roulette-wheel test 38:55 Why hand-raisers aren't the golden ticket 39:35 Brand vs. performance marketing and the “consideration set” 47:38 Thinking in bets: the poker-hand analogy 56:31 Wrapping up part one 58:04 So… is the MQL dead? (No.) 58:56 What's coming in Episode 2 1:03:05 Sign off Key Topics Discussed - Why the “MQL is dead” narrative misses the actual structural need it serves - A brief history of the MQL, from the SiriusDecisions demand waterfall to today - The Zoho CRM story: when a random number generator scored leads as well as a real model - The “original sin” of lead scoring: treating engagement data as if it were intent data - Why more data doesn't automatically mean more information - What Gartner's long-term B2B sales funnel benchmarks actually show - The HubSpot vs. Salesforce market-share example, and why “buyer-seller fit” matters - Why Marketing Qualified Accounts (MQAs) repeat the same scoring flaw at a bigger scale - Brand vs. performance marketing, and getting into the buyer's “consideration set” - “Thinking in bets”: reframing lead scoring as a probability game, not a certainty machine Notable Quotes “The problem is in the queue. What are we doing to qualify the lead?” — Dale W. Harrison “Data is a bucket — an empty bucket that may or may not contain some amount of information.” — Dale W. Harrison “Just because you have a flat tyre doesn't mean it's time to haul the car to the junkyard. You just fix the tyre.” — Dale W. Harrison Resources & Mentions - Glengarry Glen Ross (film) - SiriusDecisions demand waterfall model - Forrester Research - Gartner B2B sales funnel benchmark data - HubSpot and Salesforce market share data - Zoho CRM RevOps lead-scoring anecdote - Ehrenberg-Bass Institute (mental availability research) Next Episode In Episode 2, Dale and Liam dig into which factors can realistically move the odds of a lead converting — and which ones the data simply can't tell us, no matter how much of it we collect. Subscribe & Follow Catch every episode of B2B Effectiveness: Evidence-Based Marketing Ideas for B2B Practitioners on your favourite podcast platform, and subscribe here on YouTube for future episodes. #B2BMarketing #DemandGeneration #RevOps #MQL #MarketingAnalytics #LeadScoring
Reach and audience
Public platform figures. Ratings count people who left a rating, not total listeners.
- Spotify
- 5.0 / 5
- 2 ratings
Contact B2B Effectiveness
- Guest appearances
- Books guests
Based on episode analysis; this does not confirm that the show is currently accepting guests.
Host of B2B Effectiveness?
Claim your podcast to manage its listing and keep your show details accurate.
Pod Engine is an independent podcast discovery and analytics service and is not affiliated with or endorsed by this podcast. Artwork and show content belong to their owners. Full legal notice.
Explore this show
Podcast research with Pod Engine